Blast Radius for Agent-Assisted Development on Kubernetes
Reachability Graph Control (rgctl) - AI coding agents default to reading files sequentially. That burns context, misses structure, and produces confident wrong answers about impact and dependencies. rgctl indexes the whole repository once into a rich graph with pre-computed reachability, then serves compact, deterministic query results — so agents (and humans) get the right slice of the codebase without loading it into the prompt.
If you refactor RESTClientFor in Kubernetes by hand, you probably do not open a
call-graph tool first. not that I am suggesting you should.. but lets take it as a good example when it comes to impact on the codebase, its dependencies etc. Usually you have an IDE find-references, a mental map of
client-go, teammates who have been burned before, and CI that will catch what
you missed. For most edits, that workflow is fine.
The landscape changes when you decide to hand the same task to a coding agent. The agent
has a context window, grep, and no tenure on the team and importantly the LLM has its own limits, depending on which one you use.
On a tree with 181,000 functions, asking it to “refactor newPodWorkers safely” often
produces one of three outcomes: it reads the wrong files, stops at direct
callers and misses transitive impact, or burns most of the turn budget
exploring pkg/kubelet/ without ever reaching cmd/kubelet/main.
This post is for brave souls who work or plan to work with agents on large codebases. It explains why rgctl blast radius belongs in that workflow, what you should expect from the output, and where your existing tools are still the right choice. The examples use the upstream kubernetes/kubernetes repository — cloned locally and indexed with rgctl, not a trimmed or synthetic corpus.
How blast radius is calculated in rgctl
Blast radius answers one question: if I change this function, what upstream
code could be affected? It walks the call graph backwards along CALLS
edges — from callee to caller, caller’s caller, and so on — and returns three
things:
| Output | Meaning |
|---|---|
| Direct callers | Functions that call the target directly |
| Impact zone | Full transitive closure of upstream callers |
| Score (0–100) | A capped impact rating derived from both counts |
The score is not PageRank (even though rgctl can also calculate it) and its not guestaming it either. rgctl combines two components:
| Component | Formula | Cap |
|---|---|---|
| Direct callers | direct_count × 25 | 40 points |
| Transitive impact | impact_count × 0.05 | 60 points |
score = min(direct_component + transitive_component, 100)A symbol with no upstream callers in the static graph scores 0. A shared helper with dozens of direct callers and a large impact zone lands in the 40–50 range; scores above 50 flag architectural hotspots where both fan-in dimensions are high.
Why agents get sub-second answers on Kubernetes
Lets take a look at how this is made possible, or as my agent friends always say “lets delve into it..”
Agents work in multi-turn sessions. A live breadth-first search over 1.7M
edges on every “who calls X?” would make that unusable. rgctl does the expensive
work once, at discover time, and serves lookups from pre-built snapshots.
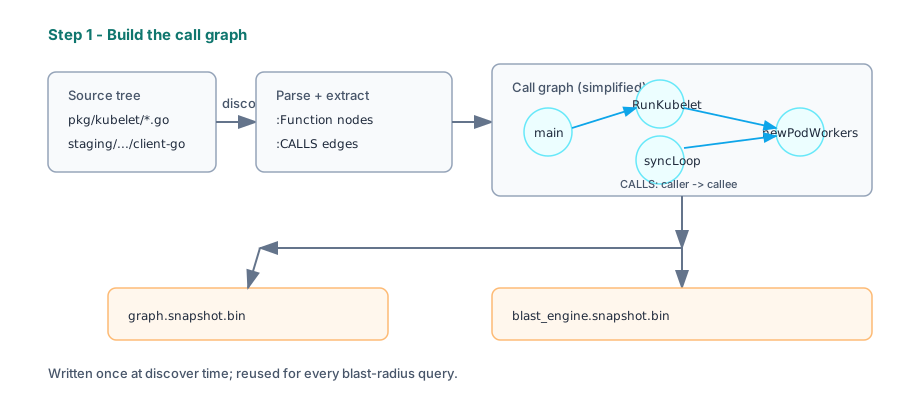
Step 1 — Build the call graph: discover parses source, extracts function
nodes and CALLS edges, and writes graph.snapshot.bin plus a dedicated
blast_engine.snapshot.bin.
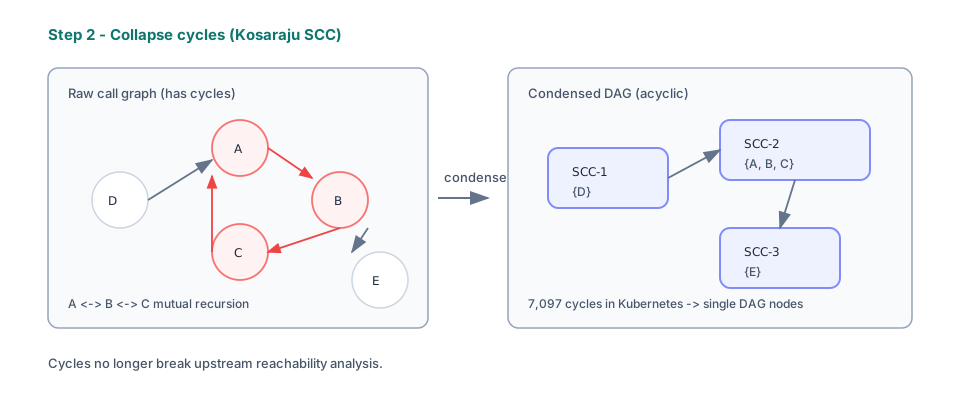
Step 2 — Collapse cycles: Mutual recursion is common in real codebases
(7,097 circular call dependencies in Kubernetes). rgctl runs Kosaraju’s
algorithm on the CALLS subgraph and condenses each strongly connected
component (SCC) into a single node, producing a directed acyclic graph (DAG).
Cycles no longer break reachability analysis.
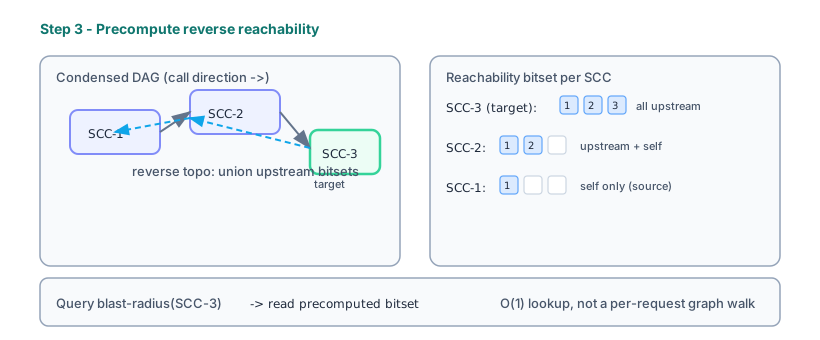
Step 3 — Precompute reverse reachability. On the condensed DAG, rgctl propagates reachability in reverse topological order, storing the result as dense bitsets — one per SCC. A query becomes a bitset read: O(1) lookup on the condensed graph, not a per-request graph walk.
Step 4 — Serve through tiers: At query time, rgctl tries the fastest path first:
- T0 — macro call lookup cache hit (
macro_call_index.db) - T1 — mmap blast engine with precomputed SCC reachability
- T3 — full graph hydrate (only when you need
--with-slicesor--policy-file)
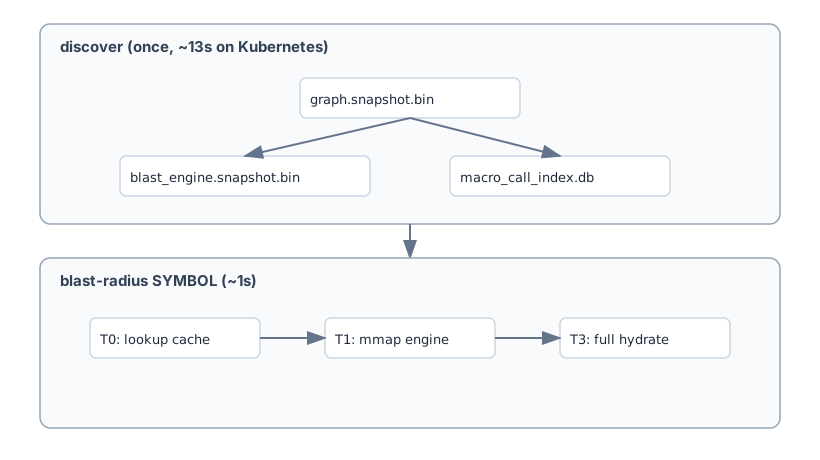
On Kubernetes that means a ~13 s one-time index, then ~1 s per symbol
query — no daemon, no remote service. Re-run discover after large merges so
the graph stays current. The full breakdown is in the
design doc.
The gap agents cannot close on their own
A typical agent turn looks like this:
You:   "Change how newPodWorkers handles static pods — keep behavior, improve readability."
Agent: [reads pod_workers.go] [greps "newPodWorkers"] [edits file] [maybe runs tests]
Before any line changes, the agent has to answer a structural question: who depends on this symbol, transitively? The usual approaches all fall short at Kubernetes scale:
| What the agent tries | What it gets | What it misses |
|---|---|---|
| Read one file | Local implementation | Callers in other packages |
grep newPodWorkers | Text matches | Upstream paths two or three hops away |
| Rely on training data | Plausible Kubernetes architecture | This checkout’s actual call graph |
| Read 20 caller files | More context, fewer tokens left for the edit | No guaranteed closure; easy to stop early |
How many times we have seen an agent confidently edit
a helper and skip the integration test package that actually exercises it. Blast radius closes that gap with a single subprocess (point rgctl -r at your
local clone of kubernetes/kubernetes):
rgctl -r /path/to/kubernetes -f json blast-radius <Symbol>The response is a few hundred tokens of structured JSON instead of tens of thousands of lines of source the agent would otherwise have to read and still fail to synthesize correctly. You can run the same command yourself in a terminal — the point is not to replace your IDE, but to give the agent (and you, when reviewing its plan) a shared, verifiable fact base.
The loop that actually works
rgctl is built around a loop that matches how Cursor, Claude Code, and similar tools operate today:
1. Your prompt        →  natural language ("what breaks if I change X?")
2. Subprocess         →  rgctl -f json blast-radius <Symbol>
3. Structured facts   →  parse schema_version + payload
4. Reasoning          →  risk summary, test plan, edit scope
5. Edit / check       →  re-query if the graph may be stale
The contract lives in AGENTS.md
and installs as a project skill via rgctl install --skill. Agents parse
stdout JSON only — not stderr, not the dashboard unless you ask for a UI.
When you review an agent’s plan, ask whether it grounded impact analysis in something like step 2, or whether it inferred callers from grep and memory. That distinction is usually visible in the quality of the proposed test plan.
Why Kubernetes is a good stress test
All numbers below come from indexing a fresh clone of
kubernetes/kubernetes — the same
tree you get from GitHub, not a fixture or subset. When working inside the
rgctl repo, ./scripts/fetch-profile-repos.sh clones it to example/kubernetes;
otherwise clone it anywhere and pass that path to -r.
| Metric | Value |
|---|---|
| Source files indexed | 26,141 |
| Functions analyzed | 181,680 |
| Graph edges | 1,789,412 |
Functions named Run | 513 |
Cold discover time | ~13 s |
Typical blast-radius query | ~1 s |
No one should have to read 26k Go files to answer “what is the upstream impact of this symbol?”. IMHO it just doesnt make sense, whether a programmer or the helper agent. Index once:
$ git clone https://github.com/kubernetes/kubernetes.git
$ rgctl -r kubernetes discover .
[✓] Loaded 26141 files -> 740986 nodes, 1789412 edges
[✓] Analyzed 181680 functions
[✓] Completed in 13.3s
discover writes artifacts to kubernetes/.rgctl/ (or wherever you cloned),
including blast_engine.snapshot.bin and a macro call lookup cache. Queries
are mmap lookups, not live graph walks over 1.7M edges.
Example: changing RESTClientFor
Suppose you ask your agent to add a default timeout to RESTClientFor in
client-go/rest/config.go.
Without blast radius, a competent agent will open the file, grep for
RESTClientFor(, find a handful of call sites, edit, and suggest:
go test ./staging/src/k8s.io/client-go/rest/...That is not wrong. It is incomplete.
With blast radius, one query returns the full upstream picture:
$ rgctl -r kubernetes -f json blast-radius RESTClientFor{
"schema_version": 2,
"target": {
"canonical_fqn": "RESTClientFor",
"file_path": "kubernetes/staging/src/k8s.io/client-go/rest/config.go",
"signature": "func RESTClientFor(config *Config) (*RESTClient, error) {"
},
"metrics": {
"direct_callers_count": 38,
"impact_zone_size": 95,
"score": 44.75
},
"topology": {
"direct_callers": [
{ "fqn": "factoryImpl.RESTClient" },
{ "fqn": "NewForConfig" },
{ "fqn": "Framework.BeforeEach" }
],
"impact_zone": [
{ "fqn": "NewKubectlCommand" },
{ "fqn": "main", "file_path": ".../cmd/kubectl/kubectl.go" }
]
}
}From this you — and the agent — can derive a concrete plan:
- Score 44.8 — not a leaf function; treat as a shared infrastructure change.
- 38 direct callers — client factories, kubectl wiring, integration and e2e setup.
- Impact zone reaches
cmd/kubectl/main— unit tests underrest/are necessary but not sufficient.
You might reach the same conclusion with IDE find-references and ten minutes of clicking. The agent will not do that reliably unless you give it a tool that returns the closure in one shot.
Context cost
This matters if you care about agent turn quality, not just correctness:
| Approach | Approx. context cost | Caller coverage |
|---|---|---|
Read config.go + five caller files | 15k–40k tokens | Partial |
rgctl -f json blast-radius RESTClientFor | 0.5k–2k tokens | Full static closure |
The agent keeps context for the actual edit and for reasoning about risk, rather than spending it reconstructing a call graph from grep output.
Example: refactoring newPodWorkers
A subtler case. You ask the agent to extract pod worker configuration into a
struct in pkg/kubelet/pod_workers.go.
Grep finds four direct call sites. That sounds low-risk.
$ rgctl -r kubernetes blast-radius newPodWorkers \
    --file pkg/kubelet/pod_workers.go
Blast radius for 'newPodWorkers'
  Score: 41.5/100
  Direct callers: 4
  Impact zone: 30
  Callers: TestFakePodWorkers, createPodWorkersWithLogger, NewMainKubelet,
           TestVolumeAttachLimitExceededCleanup
  Impact: ... NewMainKubelet, createAndInitKubelet, RunKubelet, startKubelet,
          Run, run, NewKubeletCommand, main
Four direct callers, but 30 in the impact zone — the chain runs through
kubelet construction all the way to cmd/kubelet/main.
An agent that stops at grep will under-scope the test plan. One that reads blast
radius should propose pkg/kubelet tests and the cmd/kubelet startup path,
and mention RunKubelet in the change summary.
You might get there by tracing callers in your IDE or by running
make test WHAT=pkg/kubelet and seeing what breaks. Blast radius is how you
front-load that knowledge before the agent edits, not after CI fails.
Use --depth to control noise
Kubernetes impact zones include a lot of test harness symbols. When you want a local picture rather than the full release surface:
$ rgctl -r kubernetes blast-radius newPodWorkers \
    --file pkg/kubelet/pod_workers.go --depth 2
  Impact zone: 8   # down from 30
Full closure for “what could this break in production?” Bounded depth for “what is immediately upstream?” Same command, one flag.
Example: the score-zero trap
You ask: “Kubelet.Run looks unused — can we remove it?”
$ rgctl -r kubernetes blast-radius Kubelet::Run \
    --file pkg/kubelet/kubelet.go
  Score: 0.0/100
  Direct callers: 0
  Impact zone: 0
A score of zero here does not mean safe to delete. Kubelet.Run is the
kubelet’s main loop; it is started from cmd/kubelet. For this symbol the gap
is primarily interface dispatch — fast static analysis (without heavy
pointer analysis) struggles to link a caller that holds an interface type to the
concrete Kubelet implementation. Goroutine spawns can produce the same blind
spot: the graph may not record them as CALLS edges either.
You would not delete it. An agent might, if it treats the score as ground truth.
This is the most important caveat when relying on blast radius in agent
workflows: the output is a risk signal for reasoning, not permission to
merge. When score is zero on a symbol you know is hot, disambiguate with
--class or --file, then grep for call sites the graph cannot see. The
rgctl skill
encodes this failure mode so agents do not treat “no static callers” as “unused.”
What you get in the JSON
Whether you or your agent runs the query, these are the fields worth paying attention to:
| Field | Why it matters |
|---|---|
target.canonical_fqn | Disambiguated symbol — not just a name that matches 513 Run functions |
target.file_path | Anchor for edits and citations |
metrics.score | Quick risk tier: 0 / ~25–50 / 50+ |
metrics.direct_callers_count | Immediate fan-in |
metrics.impact_zone_size | Transitive fan-in |
topology.direct_callers[] | First-hop checklist for tests and review |
topology.impact_zone[] | Full upstream checklist |
topology.scc_component_id | Hint when the symbol sits in a cycle-heavy neighborhood |
gatekeeping.policy_status | VIOLATED when a policy file rejects the change |
Text output is fine for a quick terminal check. Agent workflows and CI gates
should use -f json per the JSON API.
Disambiguation on a real tree
Kubernetes has 513 functions named Run. A bare symbol query fails loudly:
$ rgctl -r kubernetes blast-radius Run
Error: Symbol 'Run' is ambiguous. Found 513 matches.
Remediation: rgctl blast-radius "ClassName::Run"
              rgctl blast-radius "path/to/file.go::Run"
You click the right reference in your IDE. An agent needs the remediation path
in the error output — and a rule that says never pick a random row from the
disambiguation table. In practice: retry with ClassName::symbol, --file, or
--class before editing.
If you are setting up agent rules or reviewing agent output, check whether disambiguation happened before the blast-radius numbers were quoted.
Policy gates in agent-driven PRs
You can wire blast radius into automated guardrails:
{ "max_impact_nodes": 50 }$ rgctl -r kubernetes -f json blast-radius RESTClientFor \
--policy-file policy.json
# gatekeeping.policy_status: "VIOLATED", exit code 1For an agent proposing a large refactor, VIOLATED should mean stop and report
— not silently proceed. The check command runs the same rules across all
touched symbols in one pass, which fits agent-opened PRs where you want a hard
ceiling on impact zone size.
You might override that judgment on a case-by-case basis. Agents should not override it unless you explicitly say so.
When your IDE is still the better tool
Blast radius is not the right first move for every task — even in agent-assisted work:
| Your question | Often better |
|---|---|
| What calls this in the file I have open? | IDE find references |
| Will CI pass? | Run the tests |
| Is this a public API? | Module boundaries, docs, review |
| Who owns this package? | CODEOWNERS, team knowledge |
| What changed in this branch? | git diff |
Blast radius earns its place when you need transitive upstream impact as a bounded fact — before an agent edits a shared helper, before you approve its test plan, or before a high-fan-in change lands in a PR. For local edits where you already know the blast zone, skip it.
Static analysis limits (both of you should know these)
- Go interface dispatch — methods like
SyncPodmay show zero callers; the graph does not always resolve interface-typed receivers - Reflection and plugins — invisible to static analysis
- Test-heavy impact zones — Kubernetes lists many
Test*symbols; use--depthor path filters when you care about production paths only - Agents inventing callers — if a caller is not in
topology, it was not in the query result; treat that as a hallucination risk
Getting started
- Get the tool: Grab
rgctlfrom GitHub. - Test it on your own codebase: Navigate to your project root and run
rgctl discover . --export-migration-hintsto index your application.
export REPO="$(pwd)/kubernetes"
rgctl -r "$REPO" discover .
rgctl -r "$REPO" -f json blast-radius RESTClientFor
rgctl -r "$REPO" -f json blast-radius newPodWorkers --file pkg/kubelet/pod_workers.go
If you are already in the rgctl repo, ./scripts/fetch-profile-repos.sh clones
kubernetes/kubernetes into example/kubernetes — use that path for -r instead.
A useful sanity-check prompt for your agent:
Use rgctl to find the blast radius of RESTClientFor, and tell me what tests we should run before changing it based on the upstream callers.
The explicit tool invocation matters — agents sometimes skip subprocesses unless
the prompt names them. A good answer runs rgctl -f json blast-radius and cites
metrics and topology. A weak one greps the tree and guesses.
Further reading
- Blast Radius Analysis guide
- Blast radius design
- AGENTS.md — agent contract and high-value commands
- JSON API — schema v2 field reference