Konveyor Kantra CLI is a command-line tool for analyzing and transforming application source code to aid modernization and migration. It performs static code analysis to detect issues. Kantra can also extract metadata, generate deployment assets (e.g., Kubernetes manifests), and runs via containers or natively. It supports multiple languages e.g. Java, Go, .Net and Node.js and integrates with CI/CD pipelines. Kantra is the foundation for automated, LLM-powered app modernization workflows like Konveyor AI (Kai).
Kantra, comes with pre-built 2400+ rules for the Java domain. It covers stardard usecases like migrations from one JDK version to another, Spring to Spring, JBoss to Quarkus and so on. We will explore all of them in this blog series. To start using Kantra and run your custom rules, you need a way to tell it what to do. Think of it like driving a car – you need controls like a steering wheel, pedals, and buttons to make it move and do what you want. For Kantra, the primary control panel is the Kantra Command Line Interface, or Kantra CLI for short.
Kantra is also bundled into the Konveyor extension for VSCode, however in this blog we explore the CLI version. The Kantra CLI is a program you run from your terminal or command prompt. It’s the main tool you’ll use to:
Start analyzing your project’s code.
Tell Kantra which rules to use during analysis. Generate reports that show the results of the analysis. Run tests for your custom rules to make sure they work correctly. In simple terms, the CLI is how you talk to the Kantra analysis engine.
Installation
Download kantra here
Extract the archive
Rename Kantra cli and move it to PATH. (e.g)
mv darwin-kantra $HOME/bin/kantra
- Add all the files from the extracted folder into
.kantra
 cd kantra.darwin.arm64/
 mv * $HOME/.kantra
- NOTE: Mac user will likely need to run the following command before running the cli.
sudo xattr -dr com.apple.quarantine kantra
kantra analyze --input=tests/data/ssti-test-project --output=output --overwrite  --target openjdk17
 --rules rules
Lets take a look at an example of Apache Commons Text StringSubstitutor vulnerability reported in 2022. Just to be clear there is already a fix for this Vulnerability, the code is just to illustrate how Kantra works. Source code for this example can be found here on git
Visual Overview
Use Case: Analyzing Your Project
The most common thing you’ll do with the Kantra CLI is run an analysis on your code. This is how you discover potential issues based on the rules you provide.
Let’s look at an example command:
kantra analyze --input=tests/data/ssti-test-project --output=output --overwrite --target openjdk17 --rules rules
This command tells Kantra to perform an analyze action. Let’s break down what the different parts (called “flags” or “arguments”) mean:
kantra analyze: This is the main command, telling Kantra to start an analysis job.--input=tests/data/ssti-test-project: This flag tells Kantra where to find the code you want to analyze. In this case, it’s pointing to a specific example project directory.--output=output: This flag tells Kantra where to save the results of the analysis (the reports). Here, it will create a folder namedoutput.--overwrite: This flag is useful if you’ve run an analysis before. It tells Kantra to replace any existing output files in the specified--outputdirectory.--target openjdk17: This flag specifies the target environment you are migrating to. Kantra can use this information to tailor its analysis based on the destination platform or technology.--rules rules: This flag is very important! It tells Kantra where to find the rules to use for the analysis. In this example, it’s pointing to a directory namedrules. We will learn much more about Rulesets in the next blog.
When you run this command, Kantra will read the code in --input, apply the logic defined in the --rules, and generate reports detailing any findings in the --output directory.
The output from the analyzer command should look like follow:
INFO[0000]
 --run-local set. running analysis in containerless mode
INFO[0000] running source analysis
INFO[0000] creating provider config
INFO[0000] setting provider from provider config         provider=java
INFO[0000] setting provider from provider config         provider=builtin
INFO[0000] parsing rules for analysis                    rules=rules
INFO[0000] parsing rules for analysis                    rules=/Users/../.kantra/rulesets
INFO[0001] starting provider                             provider=builtin
INFO[0001] starting provider                             provider=java
INFO[0003] running depencency analysis
INFO[0003] evaluating rules for violations. see analysis.log for more info
INFO[0008] writing analysis results to output            output=/Users/...security/ssti/output
INFO[0008] generating static report
INFO[0008] Static report created. Access it at this URL:  URL="file:///Users/...security/ssti/output/static-report/index.html"
Kantra can create output in multiple formats. Here I am just using the default html version which should look something like this:
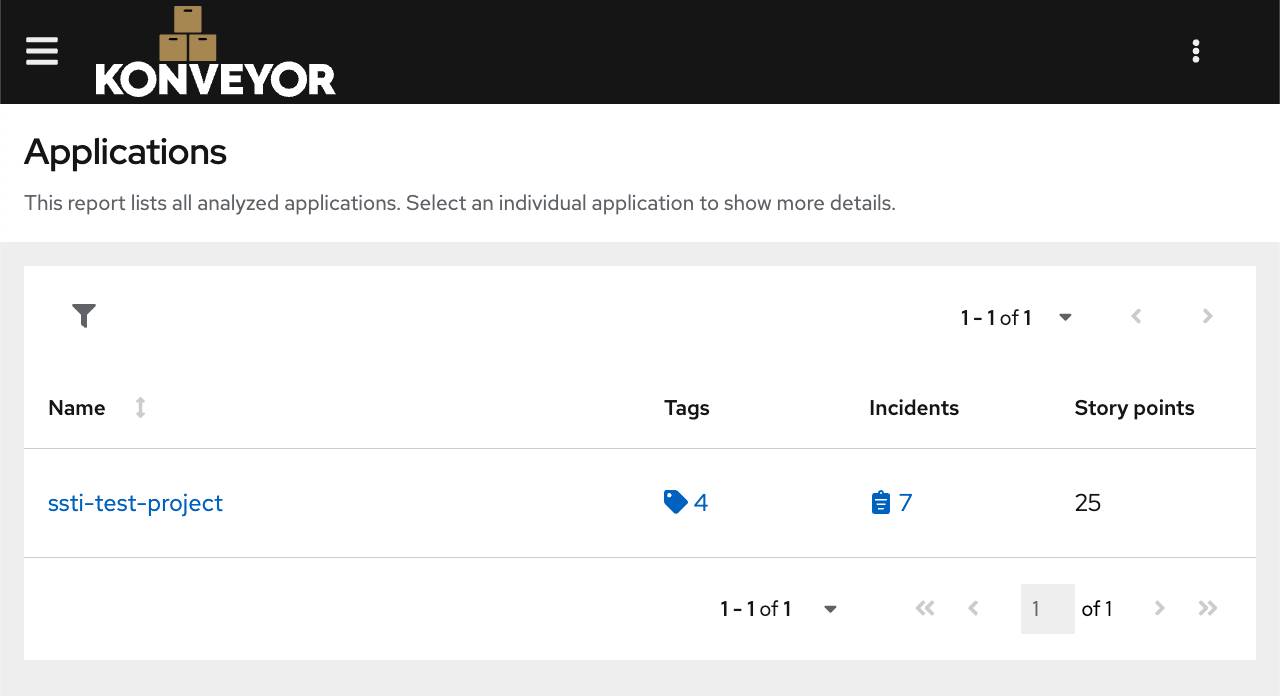
Click on the links to get more information about the incidents and the offending lines of code. Following is how it should look, clearly showing the violation and the line of code.
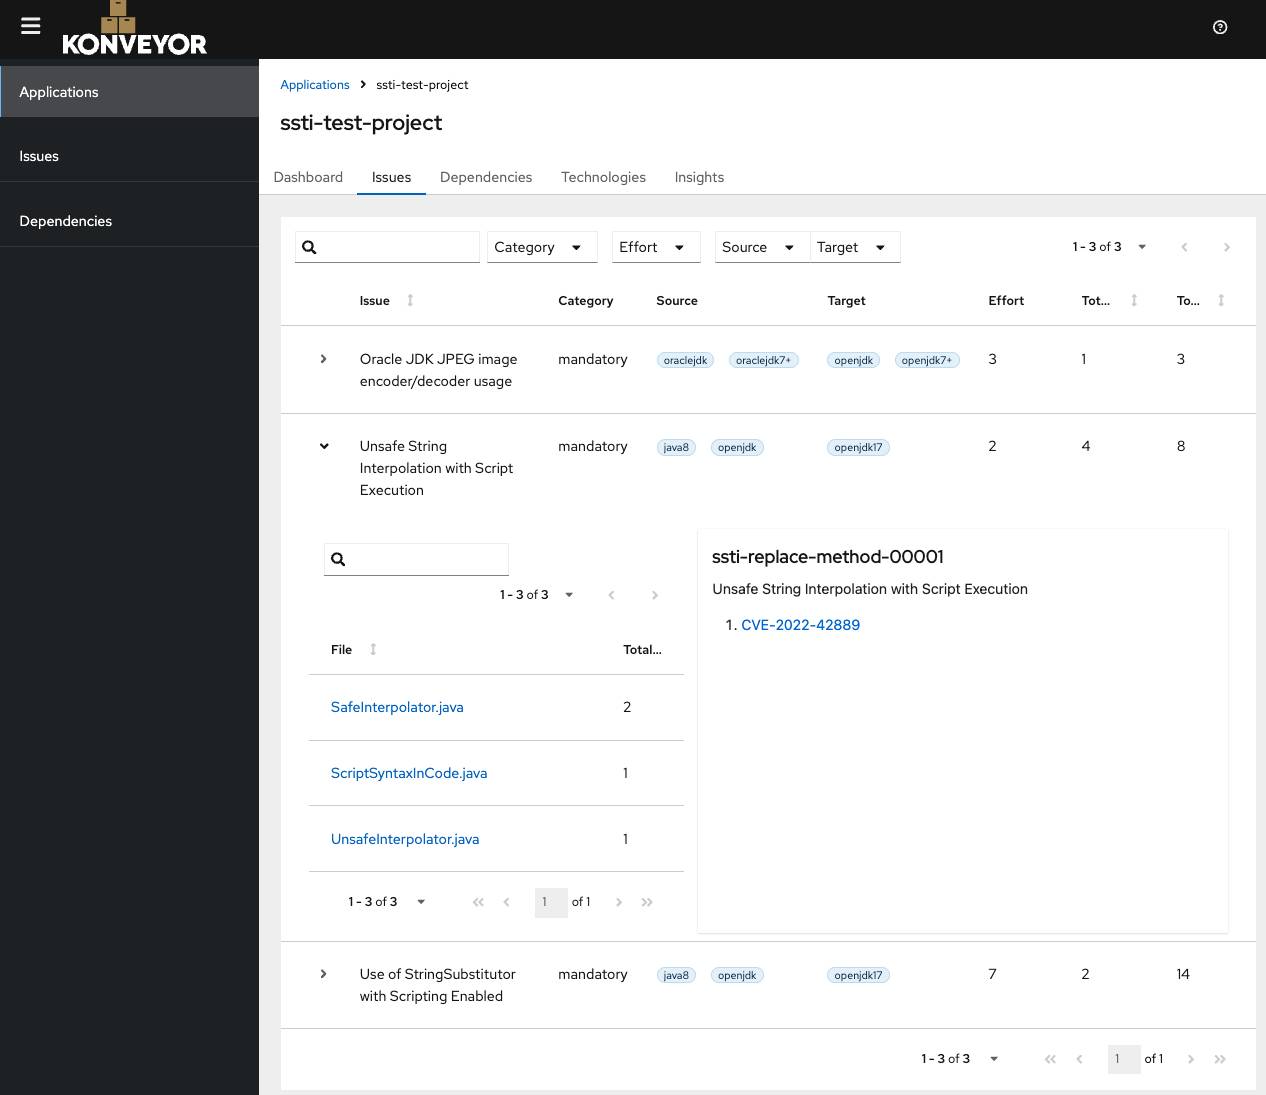
If you click on the file it should also show the code and the exact offending line.
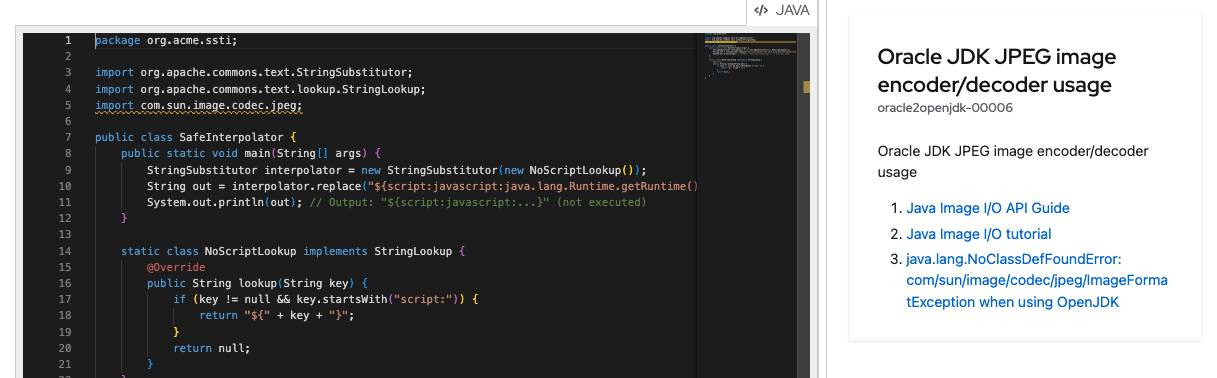
This screen shot is from one of the standard rules provided by Kantra. While developing custom rules one can also write test cases. Let’s take a look at that as well.
Use Case: Running Rule Tests
Another crucial use of the Kantra CLI, especially when developing custom rules, is running tests. Kantra has a built-in testing framework. The kantra-examples project includes tests for the example rules.
The command to run tests, as shown in the README.md, looks like this:
cd ssti/tests
kantra test .
cd ssti/tests: This first part is just changing your current directory in the terminal to where the test files for thesstiexample are located.kantra test .: This is the Kantra command. It tells Kantra to perform atestaction. The.means “test everything in the current directory”.
Running this command executes the rule tests defined in that directory. This is super helpful for verifying that your custom rules correctly identify issues in example code snippets designed specifically for testing.
Under the Hood: How the CLI Works (Simply)
You might wonder what happens when you type a command like kantra analyze ... and press Enter. At a high level, it’s a simple process:
- You run the command in your terminal.
- The Kantra CLI program starts.
- The CLI reads the command you typed, including all the flags (
--input,--rules, etc.). - Based on the command (like
analyze), the CLI knows what to do next. - For
analyze, the CLI loads the Rulesets from the location you specified with--rules. - The CLI then hands over control (and the loaded rules and input location) to the main Analysis Engine within Kantra.
- The Analysis Engine reads your Project Code (from
--input). - The Analysis Engine uses the logic from the Rules to scan your code for patterns or issues.
- If it finds something matching a rule, it creates a record of it (an Incident, which we’ll cover in Incident).
- After scanning everything, the Analysis Engine gives the results back to the CLI.
- The CLI then formats these results into reports and saves them to the
--outputlocation you specified.
Here’s a very basic sequence diagram to visualize this flow:
As you can see, the Kantra CLI acts as the orchestrator. It takes your instructions, sets up the necessary inputs (rules, code location), triggers the core analysis process, and handles the output.
Conclusion
The Kantra CLI is your essential tool for interacting with Kantra. You use it to initiate code analysis, specify which rules to apply, control input and output, and run tests for your custom rules. By understanding the basic analyze and test commands and their common flags, you have the foundation to start using Kantra in your own projects.
In the next blog, we’ll dive deeper into the concept mentioned frequently: the Ruleset. You’ll learn how rules are organized and how Kantra finds and uses them. We will also develop and understand custom rules and how they work. Until next time ;)